Documents and production plan for the Groningen field
TNO has produced the following reports and cover letters as part of the production plan procedure for the Groningen field (listed in date order):
July 2017
- Definition, determining and function of maximum magnitude in seismic hazard (TNO 17-10.058) (In Dutch)
June 2016
- Groningen field: 2013 to present; Gas production and induced seismicity (TNO 2016 R10425 May 2016).
- Review of Groningen production plan (TNO memorandum 16-10.031). (in Dutch)
- Non-linear and equivalent linear site response for the Groningen area (TNO 2016 R10460).
- Relationship between PGA values and the risk of damage resulting from induced seismicity in Groningen (TNO memorandum M0100296951). (in Dutch)
- Calculating individual risks as a result of earthquakes (TNO memorandum M0100296952). (in Dutch)
On the right:
Film of a pressure wave moving through the Groningen gas field at a depth of around 3km below the surface. Please note the date. Average pressure decline in the 12 weeks before this date is indicated in blue. Red means the pressure decline is greater than average at that date (for a comparison, see bottom of picture). The white squares denote events in or near the gas field at around 3km depth below the surface. These squares appear on the date of the event and gradually fade over time.
On the left:
The upper graph shows pressure development over time in the Loppersum area in the centre of the Groningen gas field at a point approximately 3km depth below the surface. Time is shown in numbers of weeks after the start of recording the film.
In the middle graph, the development of the pressure difference over time at the same point is compared with the average pressure in the preceding period (see bottom of picture). This is the same as in the figure on the right.
The final graph shows the events over time, plotted against the energy of the event (the released momentum).
Especially for mathematics buffs, the equation used to calculate the pressure difference is shown below :
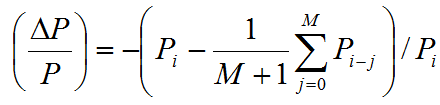
in which Pi = pressure at time ti, ΔP is the pressure difference and M is the length of the moving average (12 weeks, so M=11).
December 2015
This film shows the earthquake density in the Groningen field each month since January 2003. (film details). The film script explains the period for which earthquake density has been calculated, using a standard Geo-Information System (GIS) application (Kernel density with a 5km radius) and a cell size of 50m. The film shows an increase in earthquake density from January 2003 to January 2014 (in the film: JAN 2014 = earthquake density from January 2013 to January 2014). The earthquake density has generally decreased from January 2014 onwards (for more details, see the report).
- Memorandum: The effect of variations and fluctuations in production on seismicity in the Groningen field (November 2015) (in Dutch).
- Memorandum: Hazard maps (November 2015) (in Dutch).
June 2015
- Location-specific risks for individual premises in the area affected by the Groningen field (May 2015) (in Dutch).
- Recent developments in the seismicity of the Groningen field in 2015 (May 2015).
- Cover letter for the 'Recent developments in the seismicity of the Groningen field in 2015' report (May 2015) (in Dutch).
- Groningen Seismicity for NPR 9998, Phase 1 report. TNO 2014-R11662 (December 2014) (in Dutch).
- Cover letter for the 'Groningen Seismicity for NPR 9998, Phase 1 report’ (June 2015) (in Dutch).
- Safety considerations – Groningen earthquakes for NPR 9998. TNO 2013 R12071 (April 2015) (in Dutch).
January 2015
- Dutch summary of the TNO report “Recent developments of the Groningen field in 2014 and, specifically, the southwest periphery of the field” (December 2014) (in Dutch).
- Recent developments of the Groningen field in 2014 and, specifically, the southwest periphery of the field (December 2014) .
- Letter by TNO and CBS (Statistics Netherlands) on comparing statistical methods (in Dutch).
March 2014
- TNO supplementary memorandum, March 2014 (in Dutch).
- Effects of various production scenarios on compaction distribution in the Groningen field in the period from 2014 until the end of 2016 (March 2014) (in Dutch).
- Technical Report accompanying the TNO report of March 2014 (in Dutch).
December 2013
- Cover letter, January 2014 (in Dutch).
- Evaluation of forecasted subsidence and seismic hazards as a result of gas production in the Groningen field (December 2013) (in Dutch).
Recent papers and conference presentations on induced seismicity in Groningen
2014-2016
- Fokker, P.A. and Van Thienen-Visser, K., Inversion of double-difference measurements from optical levelling for the Groningen gas field, International Journal of Applied Earth Observation and Geoinformation, 49: 1-9, 2016.
- Van Thienen-Visser, K., Pruiksma, J.P. and Breunese, J.N., Compaction and subsidence of the Groningen gas field in the Netherlands, doi: 10.5194/PHIAS 372-367-2015.
- Fokker, P.A. and Van Thienen-Visser, K., Inversion of double-difference measurements from optical levelling for the Groningen gas field, doi: 10.5194/PHAIS- 372-375-2015, doi:10.5194.
- Van Thienen-Visser, K. and Breunese, J.N., Induced seismicity of the Groningen gas field: History and recent developments, The Leading Edge 43(6):664-671, 2015.
- Wees, J.D., Buijze, L., Van Thienen-Visser, K. and Fokker, P.A., ‘Geomechanics response and induced seismicity during gas field depletion in the Netherlands’, Geothermics 52: 206-219, 2014.
- Pruiksma, J.P., Breunese, J.N., Van Thienen-Visser, K. and De Waal., H., ‘Isotach formulation of the rate type compaction model for sandstone’, International Journal of Rock Mechanics and Mining Sciences, 78:127-132, 2015.
- De Waal., H., Van Thienen-Visser, K. and Pruiksma, J.P., Rate type isotach compaction of consolidated sandstone, ARMA 15-436, 2015.
- Fokker, P.A. and Van Thienen-Visser, K. On the use of double differences in Inversion of surface movement measurements, ARMA 15-096, 2015.
- Steenbergen, R.D.J.M. and Vrouwenvelder, A.C.W.M, Reliability based assessment of buildings under earthquakes due to gas extraction, Heron 2014 2/3.
- Steenbergen, R.D.J.M., Vrouwenvelder, A.C.W.M. and Scholten, N., Veiligheidsfilosofie bij aardbevingsbelasting, Veiligheid en rekenwaarden belastingen en sterkte bij aardbevingen, Cement 01/2015.
- Scholten, N.P.M., Vrouwenvelder, A.C.W.M. and Steenbergen, R.D.J.M., Gas extraction and necessary earthquake regulations, Cobra 2015.
Links to websites with additional information on the Groningen field and induced earthquakes
Information on the registration of induced events can be found on the website of the Royal Netherlands Meteorological Institute (KNMI). The namplatform site presents the most recent information on the Groningen field from NAM, the operator. The Groningen Ground Movement (Groninger bodembeweging) lobby has built its own portal containing information on the gas field and induced seismicity. Since early 2015, homes have started being reinforced to improve their safety, as well as their occupants’ quality of life and the economy in general. The state, provincial and municipal authorities have appointed a National Groningen Coordinator to ensure that these operations proceed promptly and effectively. The Dutch Practical Guideline (Nederlandse Praktijkrichtlijn = NPR) on earthquake-proof construction can be found on the NEN website.