The Groningen field was discovered in 1959 and at that time turned out to be the largest natural gas field in the world. Production started in 1963 and NAM (Nederlandse Aardolie Maatschappij), the joint venture between Shell and Exxon Mobil which operates the field, estimate the initial recoverable reserves at 2900 billion cubic metres (Nm3). Since the start there is still approximately 470 billion Nm3 available as resource. As Groningen gas is relatively rich in nitrogen (14%), its calorific value is lower than that of most other gas fields in the Netherlands. Owing to the Groningen field’s huge volume, most domestic appliances (e.g. for heating and cooking) in the Netherlands, Germany, Belgium and Northern France have, since the 1960s, been adapted to use this low-calorific gas.
Lithology and reservoir characteristics
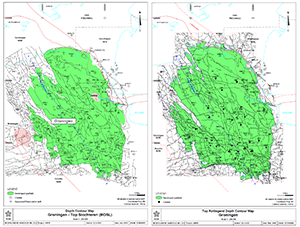
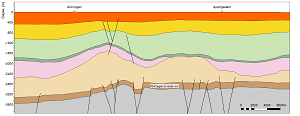
The Groningen gas field reservoir is the Upper Rotliegend Group of Early Permian age (Figure 1). Figure 2 shows a cross-section through the entire reservoir. The reservoir is located at depths of between 2600 and 3200m. The total thickness of the Rotliegend in the Groningen field ranges from approximately 100m in south-southeast to approximately 300m in north-northwest. From east to west the Rotliegend thickness is fairly uniform. The Upper Rotliegend Group has been subdivided into the Slochteren Formation (reservoir rock) and the Silverpit Formation (non-reservoir rock). The Slochteren Formation is a sequence of conglomerates and course-grained sandstone layers deposited in sheet floods and fluvial braiding channel fills, interbedded with fluvial medium-grained sandstone layers deposited in a desert plain and finer-grained aeolian dune and sand-flat deposits. The Slochteren Formation is overlain by the Ten Boer and Ameland Members of the Silverpit Formation. The claystone of the Ameland Member is restricted to the northern part of the Groningen field, where it separates the Slochteren Formation in the Upper and Lower Slochteren Formations, and forms a potential barrier to flow. The Ten Boer and Ameland Members were deposited in the southern Permian Basin, which at the time comprised a desert lake environment. The gas now contained in the Slochteren Formation is migrated from the coal layers in the underlying Carboniferous. The thick impermeable salt and anhydrite layers of the overlying Zechstein Group form the seal that traps the gas in the Rotliegend reservoir rock.

Figure 1 Structure map of Groningen gas field. The depth contours represent respectively the top of the Slochteren Formation (left) and the top of the Rotliegend (right)
Structural setting
The gas-water contact in the Groningen field is encountered at depths between 2971m in the north-east of the field to 3016m in the south-west. The Groningen field is cut by several fault systems, subdividing the field into a large number of fault blocks. Most fault systems trend either east-west or north-northwest to south-southeast, and the throw can be up to 200m. Permeability is generally not affected by the faults that intersect the field. The Groningen field is mainly delimited by faults, and in a few places by ‘dip closures’.
Figure 2 Geological cross section of the Groningen gas field
Production
In view of the increased induced seismicity, the volume of gas to be produced from the Groningen gas field has, since 2014, been determined by the Minister of Economic Affairs in a decree on the Groningen production plan. For the 2015-2016 gas year, the maximum production was set at 27 billion Nm3. Since then this is further decreased to 4.6 billion Nm3 (average temperature) for the gas year 2021-2022. The Dutch government also publishes News on the decision-making process on its website. More information on the production from the Groningen gas field can be found on Dashboard Groningen, Datacenter on NLOG and in the Annual report - Natural resources and geothermal energy in the Netherlands.
In view of the special situation of the Groningen gas field, the most important technical reports drawn up by TNO in relation with the induced earthquakes can be found under the tab public SHRA Groningen. The annual risk analysis carried out by TNO can also be found here.

